Every flight leaves a fingerprint. We use it to make flying safer.
Flightrac records how each flight is actually flown, then turns it into feedback that reaches the pilot before the next one. Risk gets seen and fixed while it is still a habit, not an accident.
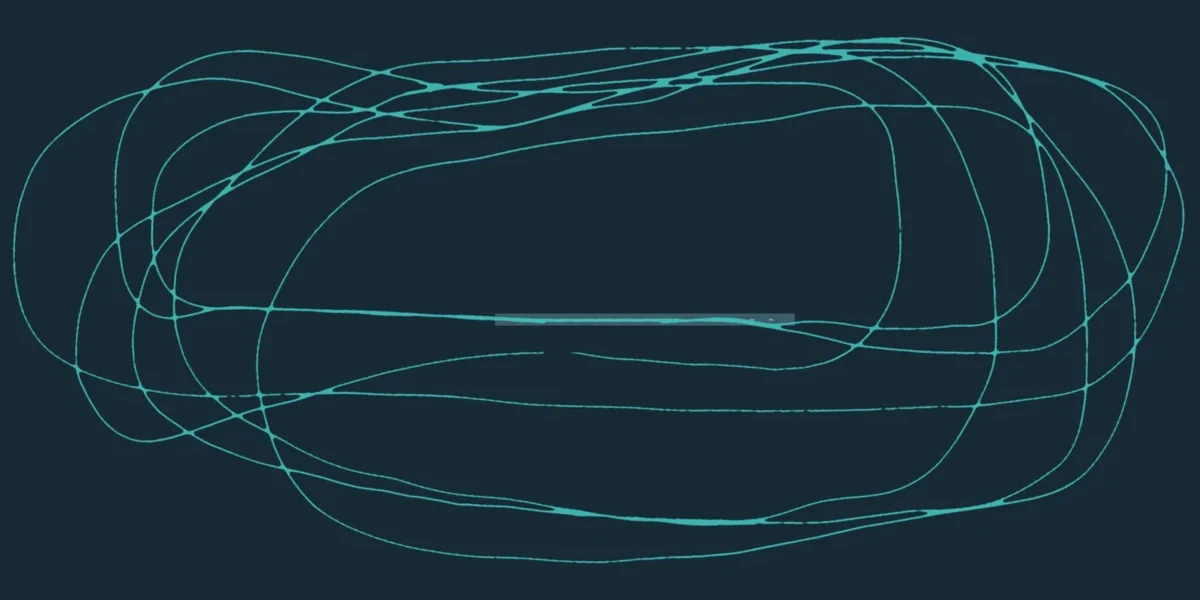
A real circuit session Every loop is a recorded circuit. The amber mark is a go-around, picked up from the flight data.
2,000+ hours of recorded flight data
Four Australian air races scored since 2022
Live tracking over satellite and mobile networks
The aircraft where most accidents happen carry the least data.
Airlines learn from every flight. In light aviation, most of what happens in the air is never recorded, so the same risks repeat quietly until one of them becomes an accident.
Risk that builds unseen
Unstable approaches and low-speed handling develop flight by flight, long before anyone can measure them.
Damage nobody reports
Hard landings and engine exceedances go unnoticed. The aircraft remembers them. The paperwork doesn’t.
Lessons that are lost
When something goes wrong, the evidence is often gone, and the industry pieces together what happened from memory.
Two sessions. Two fingerprints.
Both are real circuit sessions, recorded by Flightrac. One is tidy and repeatable. The other wanders, crosses itself and never settles. A logbook records them the same way.
Consistent. The same pattern, circuit after circuit.Worth a conversation. Varied shapes, no two circuits the same.
One session, read properly.
Eight circuits in one real training session: five landings and three go-arounds. Flightrac marks every one, and any approach opens in 3D with its landing written up in plain terms.
Altitude above the fieldLandingGo-around
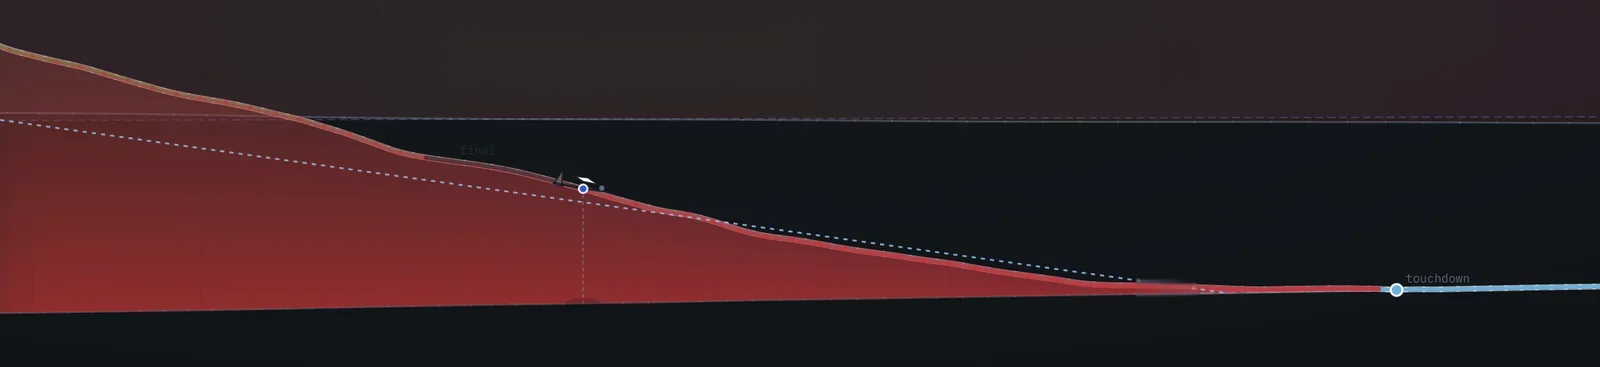
Landing 2, final approach. Shaded red where it left the stabilised approach as measured against the ICAO standard. The blue dotted line is the glide slope.
Landing 2 record
Approach sink
360 ft/min
Touchdown sink
32 ft/min
Airspeed at touchdown
30 kt
Drift
0°
Touchdown
Soft, 1.2 g
Wings level
1°
Round-out
About 10 ft, on profile
Unstable approach
Airspeed unstable on final. The landing itself was soft, which is exactly why nobody would have mentioned it.
Every flight is also a record of the aircraft.
The pilot is half the story. Flightrac reads the engine and the airframe on every flight too, so a maintainer sees a trend while it is still a trend, not a fault.
Engine
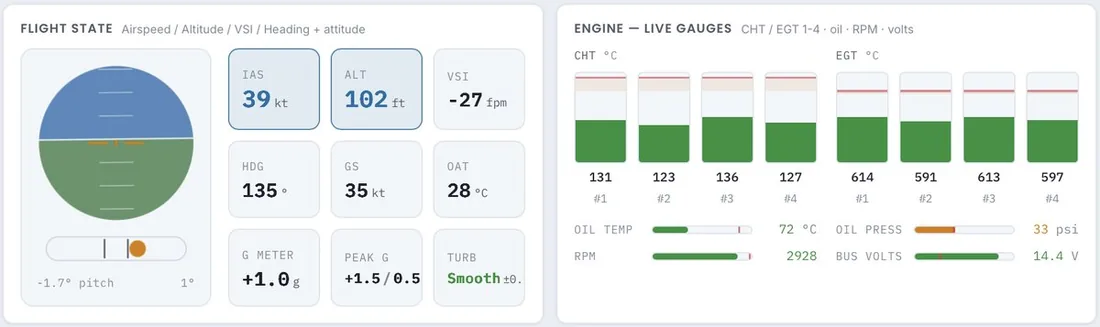
With a connected engine monitor, every cylinder is tracked flight by flight against the manufacturer’s limits.
Worth a look
Cylinder 3 runs hottest on every flight, on average 32 °C above cylinder 2. Baffling and timing are where a maintainer would start. No rising trend yet.
Flightrac checks its own sensors too. One exhaust temperature probe read over range on every flight, so it was flagged as suspect instead of being reported as a real peak.
Airframe
Every touchdown is scored for load, sink rate and alignment, and counted against the aircraft. Training puts more landings on an airframe than any other flying.
Landing loads 69 touchdowns
0hardover 2.1 g
9firm550 ft/min or more
5bounced
0ballooned
6nose-first or flat
2drift onover 8°
A pattern to work on
No hard landings in 69, but nine firm and six nose-first or flat. That is the wear pattern behind nose gear damage, and it shows up here before it shows up in the hangar.
Decision support to guide a maintainer’s inspection, not an airworthiness determination.
A feedback loop for every flight.
There is nothing to switch on and no change to the pilot’s routine. Flightrac records every flight in the background, and the insight is waiting when the aircraft is back on the ground.
1. In the aircraft
Capture
The recorder logs how the aircraft is flown and, where connected, how the engine is running.
2. In the cloud
Process
Each flight is uploaded and broken down into performance, engine data and airframe loads.
3. On your dashboard
Report
Clear reports in plain language, and alerts emailed to the account holder automatically.
4. The next flight
Prevent
Patterns are caught while they are still habits, and every flight sharpens the next.
From raw data to clear decisions.
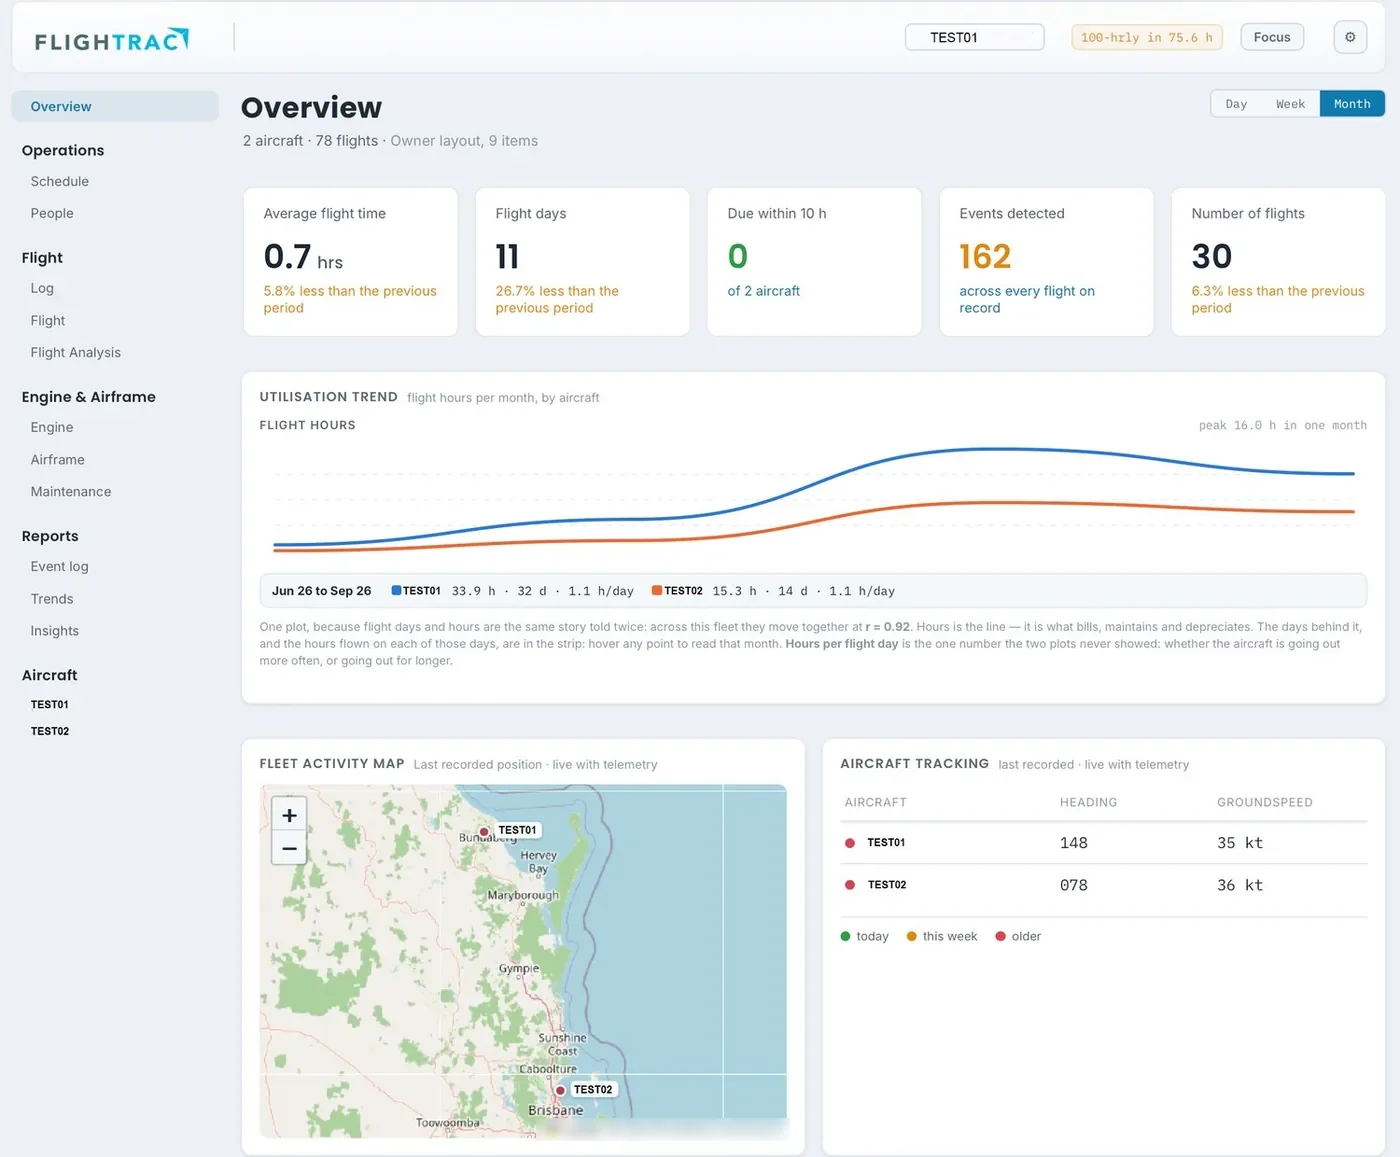
Choose a feature to see where it lives in the Flightrac platform.
Unstable approaches, exceedances and near-stall events are highlighted automatically, so they can be addressed early.
Follow aircraft live on the Flightrac web platform over mobile and satellite networks, with position updates at least every five minutes, even in remote areas.
Loads, hard landings and hours tracked per aircraft, with findings prepared for your maintainer.
Replay any flight and talk through what the data shows, not what anyone remembers.
With a connected engine monitor, temperature and power trends are tracked flight by flight against the manufacturer’s limits.
Safety reporting and risk tracking that draw their evidence from the flights themselves.
Safer flying is shared work.
Pilots and instructors
Objective feedback after every flight, so good habits are reinforced and risky ones are caught early.
Owners and operators
Follow every aircraft live, see how it is being flown and treated, and act on risk before it becomes damage or worse.
The wider industry
Accurate, independent flight data helps the whole sector understand where accidents begin, and how to prevent them.
Built to be trusted.
Safety tools fail when they shout. A system that flags everything teaches people to ignore it, so every Flightrac flag has to earn its place.
We state what the data shows
Every finding says what was measured and against which limit. Where data is missing, the platform says so rather than guessing.
Learning, not blame
Flightrac is built around just culture. Flight data goes to the people responsible for the aircraft, to improve how it is flown.
Maintenance goes to your maintainer
Engine and airframe findings are prepared in a report that can be shared with an authorised maintainer, in line with the manufacturer.
Flags that mean something
Thresholds are tuned against real flights so a flag is worth reading. Decision support for the operator, never an airworthiness determination.
Built tough. Tested across a continent.
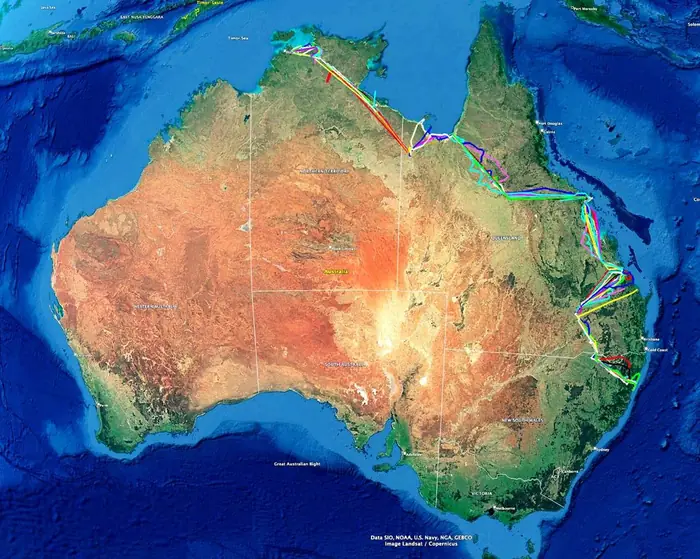
Flightrac portable recorders tracked and scored competitors at the Outback Air Race in 2022 and 2025, and at another Australian air race in 2023 and 2024, across thousands of kilometres of remote terrain.
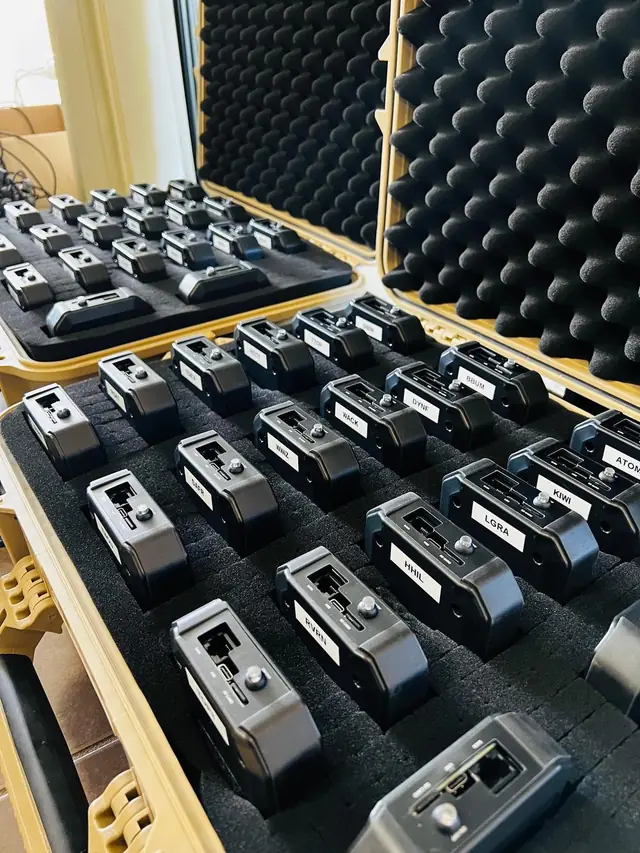
Race data Competitor tracks recorded across AustraliaPortable recorders, ready for the start line
One proven core. Two ways to fit it.
The installed recorder is built on the same proven core. It connects directly to the aircraft’s own engine and flight data, so every cylinder, every load and every landing is monitored, flight after flight.
Portable
Portable recorder
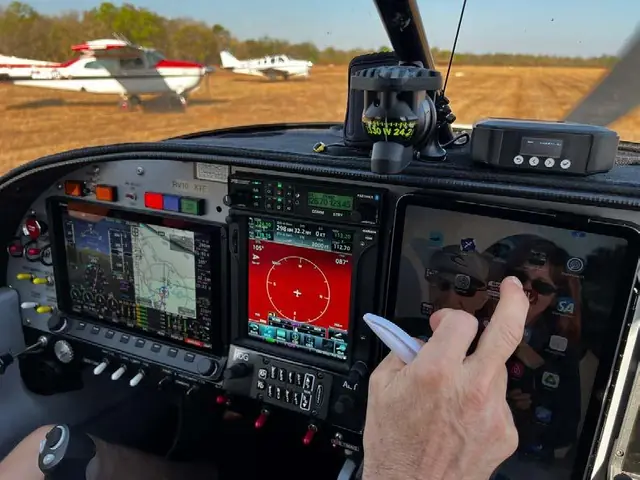
Sits on the glareshield and stays with one aircraft, building a profile of how that aircraft is flown and used. Proven at four Australian air races since 2022.
Live tracking
The full flight path, recorded and replayable
Flight data from the onboard sensors
Runs on USB power, with a built-in backup battery
Installed
Installed recorder
Fitted in the panel and connected to the aircraft’s avionics. Records every flight automatically, with nothing to carry or switch on.
Everything the portable recorder does
Instrument performance data, such as airspeed, altitude and attitude
Engine monitoring, cylinder by cylinder
Airframe loads and every landing, counted
The full Flightrac platform
Fewer accidents. Fewer lives lost.
Human error drives most light aircraft accidents, and the evidence that could prevent the next one is almost never recorded. We want to bring the data culture that made airline flying so safe to every light aircraft.
That starts with better pilot training: objective feedback after every flight, so good habits are reinforced and risky ones are caught early. And it extends to the aircraft itself, helping owners and maintainers spot the early signs of engine and airframe issues before they become expensive or dangerous.
Flightrac was founded by a flight instructor and a team of engineers who have seen the cost of not knowing. We are building an honest record of every flight, read carefully, and put in front of the people who can act on it.
Building the data culture light aviation has been missing.
Flightrac is privately held and preparing for commercial launch. We welcome conversations with experienced investors who share our view that every aircraft deserves a system that protects pilots and aircraft.
The flight plan so far
2022Outback Air RaceRecorders track and score the field across remote Australia.
2023 and 2024A second Australian air raceTwo more years of competition flying, recorded and scored.
2025Outback Air Race, againBack for another crossing of the continent.
NowThe Flightrac platformFlight analysis, live tracking and safety reporting, developed on real flight data.
NextCommercial launchPreparing now.
Speak with our founders
Leave your details and we will be in touch to arrange a briefing.
This website does not offer securities. Information about any investment opportunity is provided on request, only to wholesale or sophisticated investors as defined in the Corporations Act 2001 (Cth).
We use Google Analytics to understand how visitors use this site. Analytics cookies are only set if you accept. No advertising, and nothing is sold or shared for marketing.